
MIS Reporting | Dashboard | Analytics
Analysis of your Business performance by MIS Reporting with attractive Dashboards & Charts.
MIS stands for the Management Information System, which is used by most organizations to visualize data for better decision making. It provides a view of daily activities to evaluate business processes, discovers problems, and make decisions.
- We collect the raw data scattered in different Accounting & Management systems, in departments like Accounts/Finance, Human resources, Operations, Marketing, and so on.
- Then, we combine this data in Excel and clean up the data to filter the information that is required for particular MIS reports.
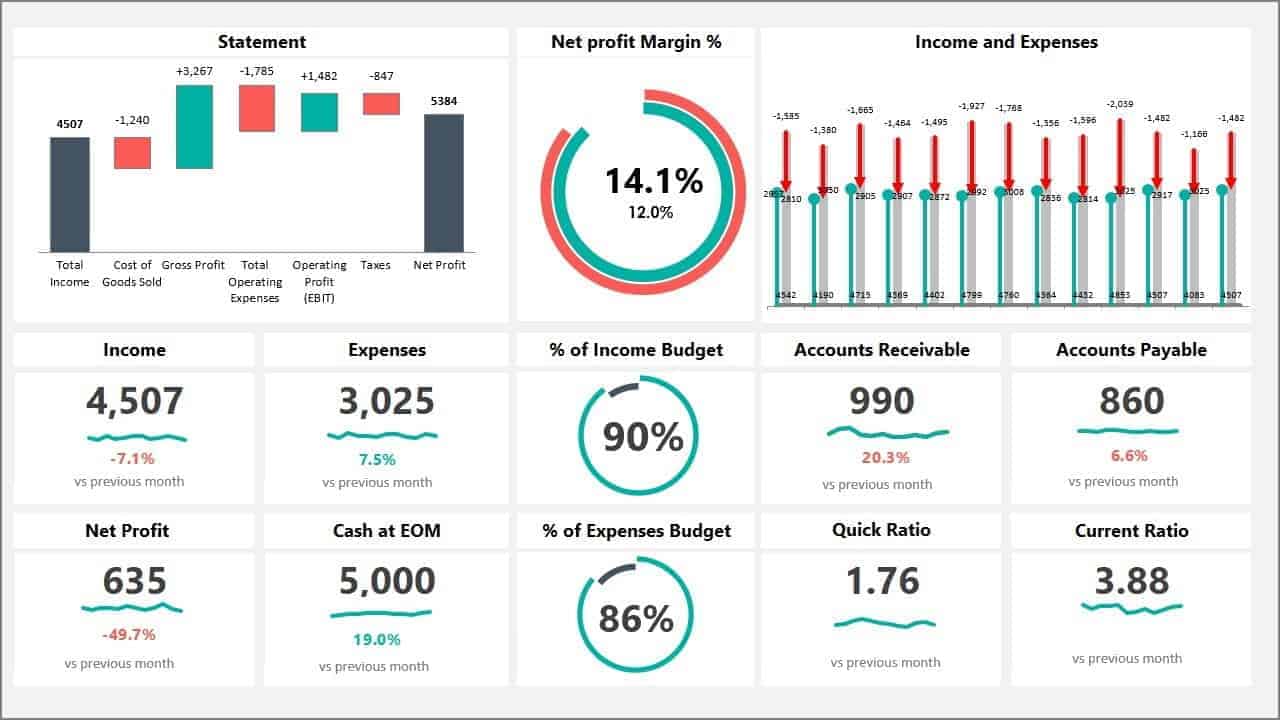
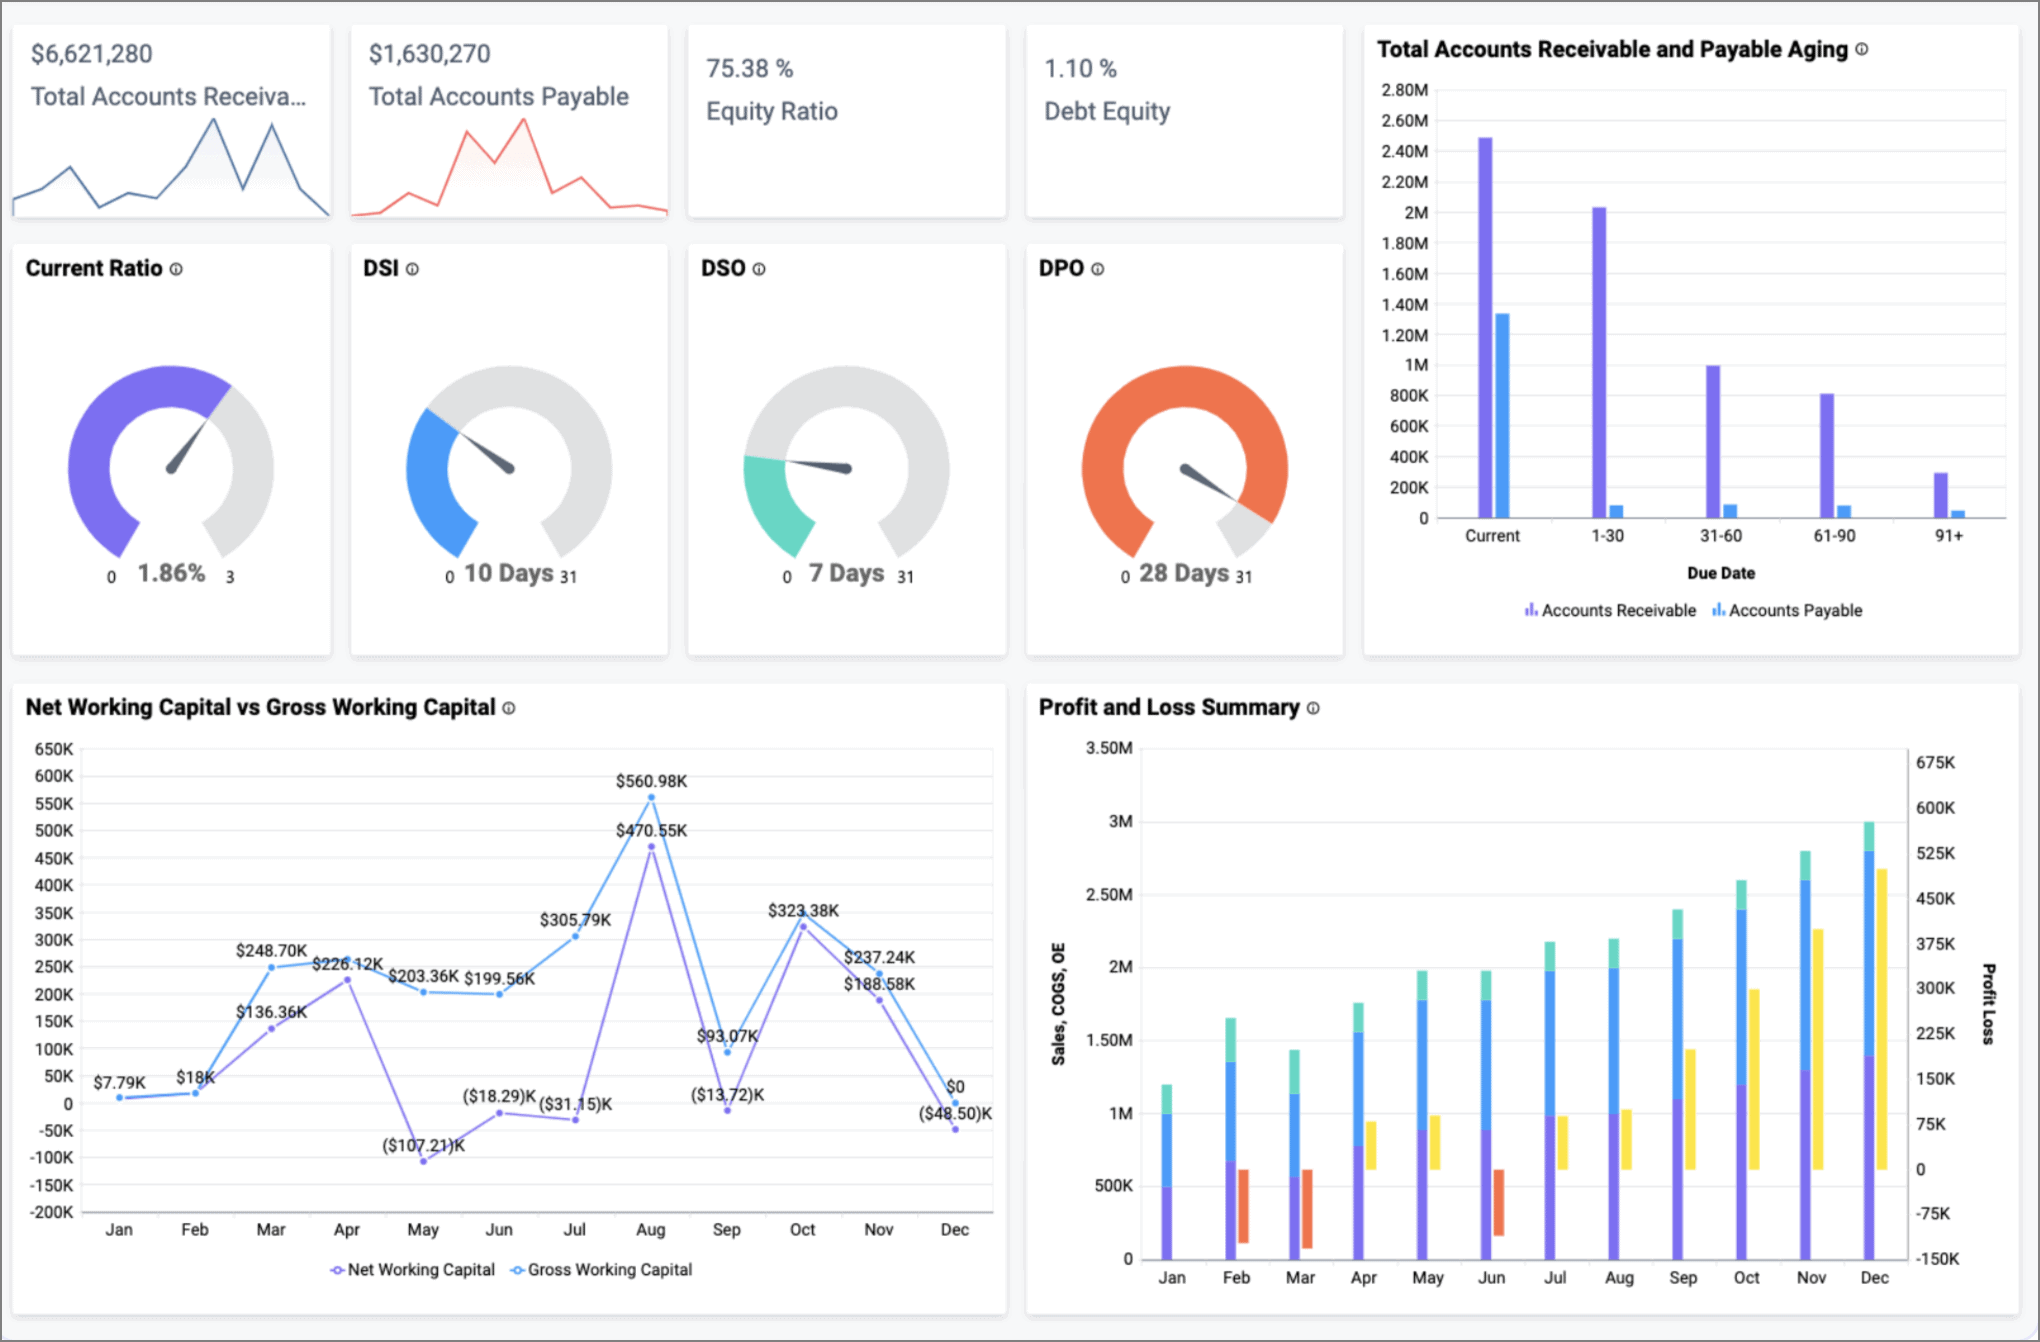
- Next, we link the data to the MIS template which includes attractive Dashboards and other Visual Charts for Analysis.
- We check the report if the numbers are following the trend and serve you the final result.


Kishor Ahuja –
Exceptional service. Professional and self driven approach. Master in Reports & Dashboards.